
Effective SEO reporting: How to analyze your keyword set


Effective SEO reporting: How to analyze your keyword set
Monitoring and SEOreporting go hand in hand: Monitoring allows you to continuously collect data about your website, which you can then analyze in regular reports. This way, you always know exactly where your website stands – and what you should improve. In this article, I explain how I, as an SEO consultant, create reliable reports for my clients: what format, what information should be included, and which tools I use. Create your own report in 3 – 2 – 1 – now!Monitoring and SEOreporting go hand in hand: Monitoring allows you to continuously collect data about your website, which you can then analyze in regular reports. This way, you always know exactly where your website stands – and what you should improve. In this article, I explain how I, as an SEO consultant, create reliable reports for my clients: what format, what information should be included, and which tools I use. Create your own report in 3 – 2 – 1 – now!
What you can expect in this post
A word about the format
SEO reporting comes in various formats: Excel spreadsheets, Google Sheets, PowerPoint presentations, or PDFs.
I personally always create my SEO keyword reports in PDF format.
Why?
- PDFs are easy to share and compatible with all operating systems.
- Your reports look the same on every device, making them clear and easy to read. No unpleasant surprises like shifted lines or cut-off graphics.
- Each section is always in the same place in every SEO report, which makes comparison easier.
- PDFs are also practical for archiving. This way, you always have your reports readily available and can easily find them again.
- Furthermore, PDFs simply look more professional than an Excel file with dozens of columns and rows.
SEO reporting – what should it include?
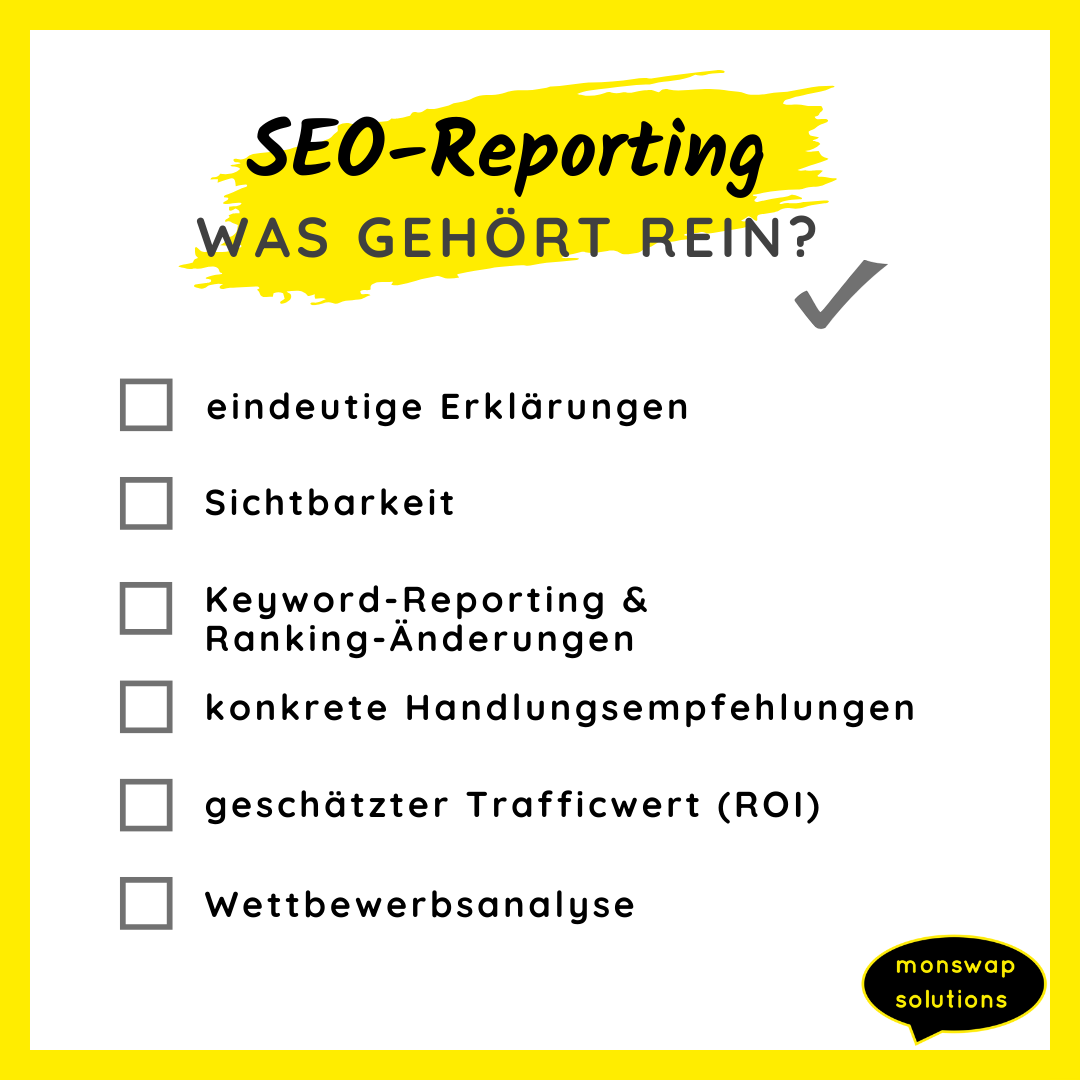
A good SEO report should above all be clear, well-structured, and self-explanatory. Of course, different companies need an overview of different key performance indicators (KPIs).
These six important elements should be found in every good report:
1. Clear explanations
If all you see when looking at the report are question marks, it's not good reporting.
A good SEO report presents the key figures so clearly that everyone from the first-week intern to the CEO knows what's being discussed and what those numbers mean.
2. Visibility: How is your website developing?
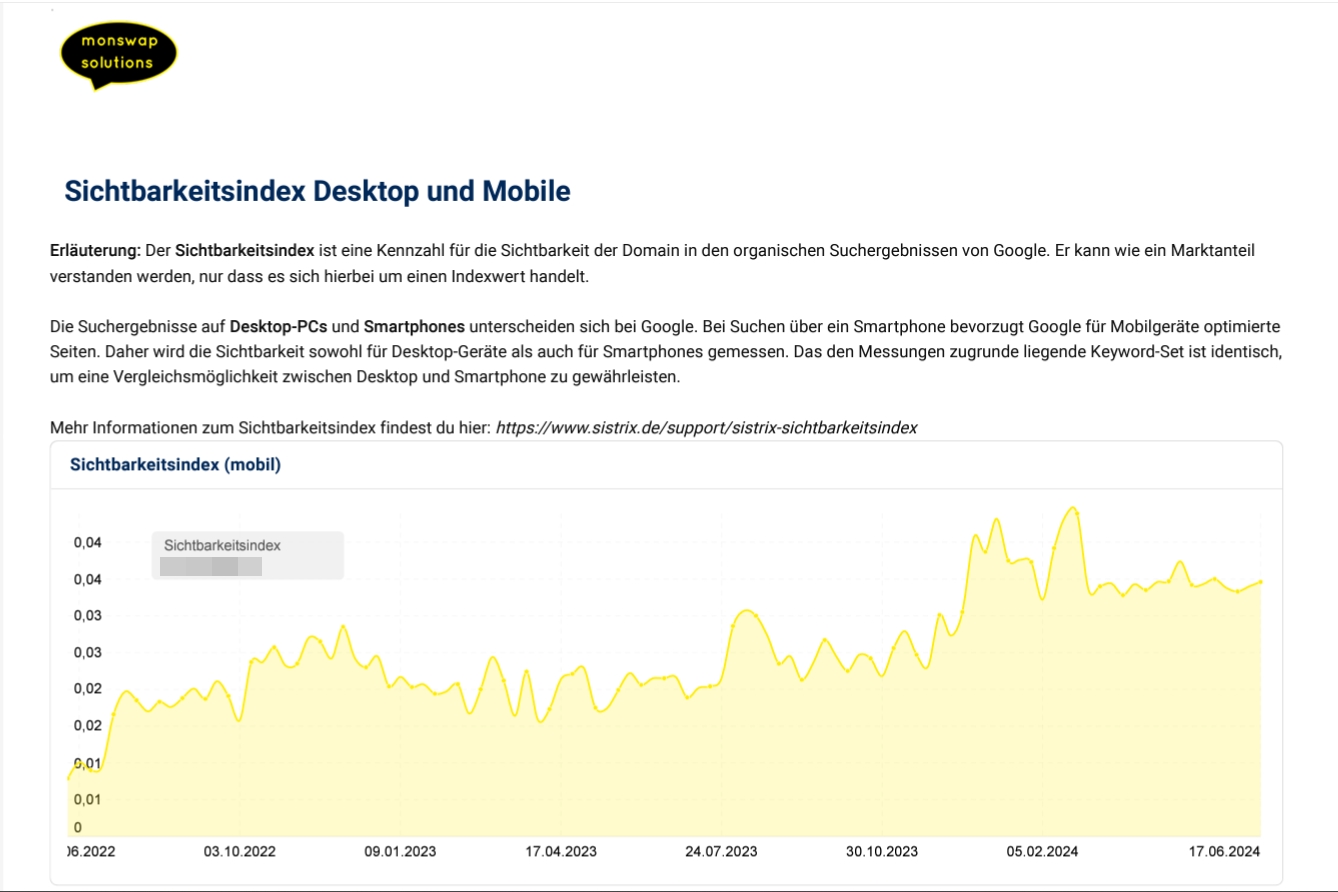
At first glance, the report should immediately show you how the website has developed since the last SEO report. Depending on the tool, this factor is called the "Visibility Index" (Sistrix) or "Performance Index" (Mangools). It is usually displayed as a graph.
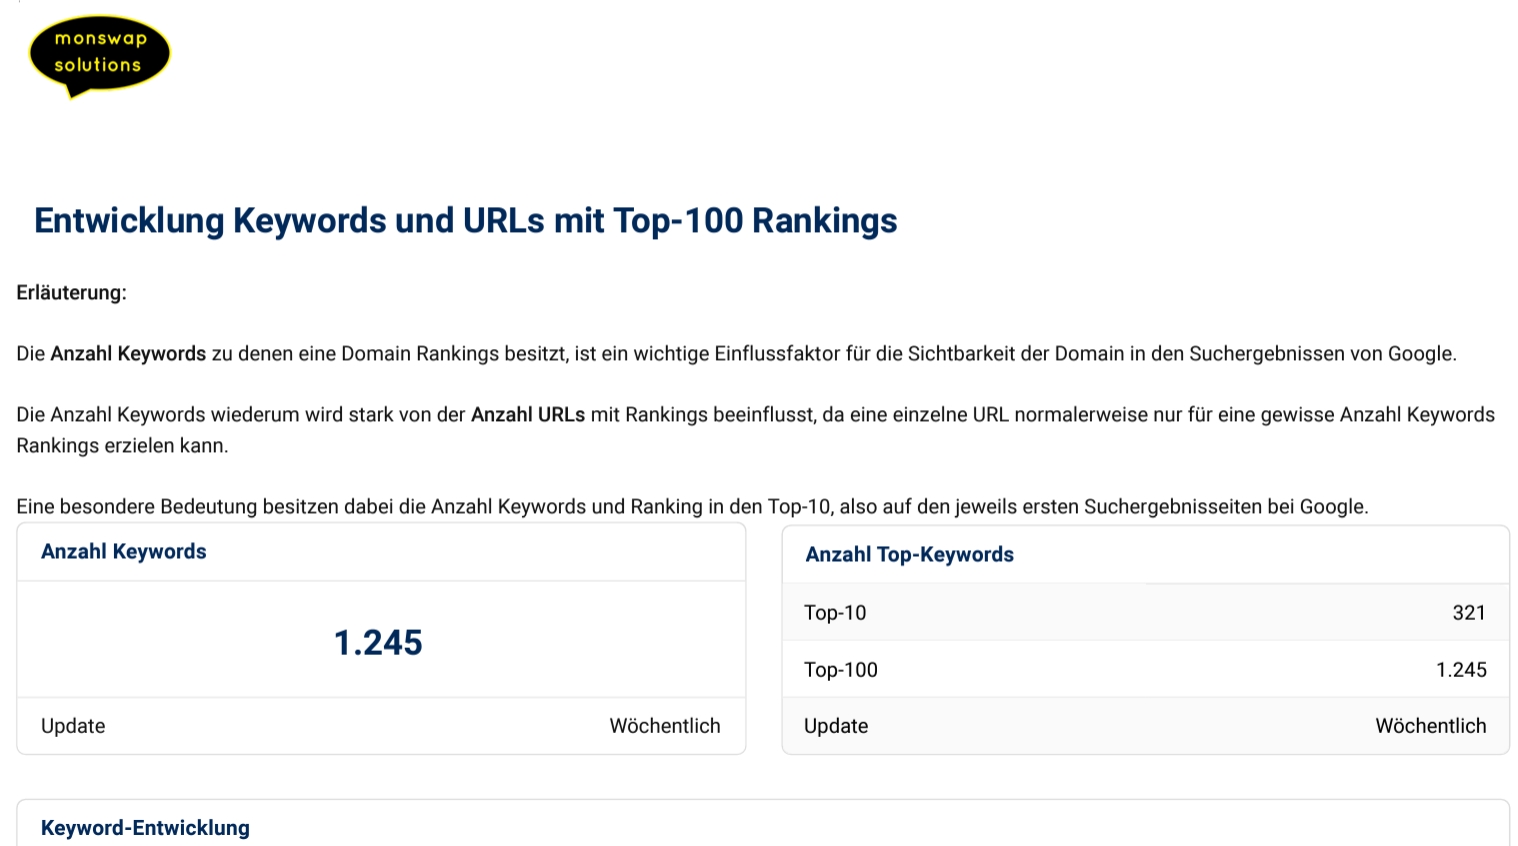
3. Keyword reporting & ranking changes: Which content performs how well?
Crucially: How have the rankings for relevant keywords changed? For which search term are you on page 1, and which has dropped below 100 (= into SEO oblivion)?
In doing so, I compare:
- What new keywords have been added?
- For which existing keywords has the ranking improved?
- Which pages rank better now?
- And which ones crashed?
This data is essential to understand what works on your website – and what doesn't (yet).
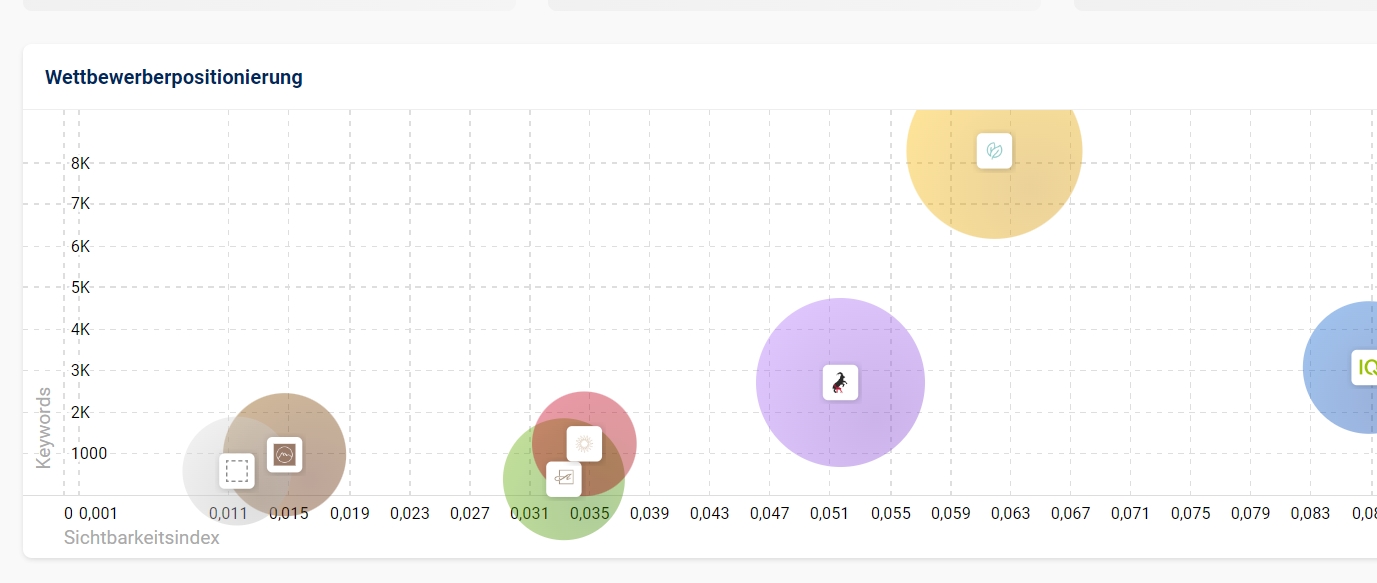
4. Competitive analysis
Want to know how your website compares to the competition ? And how your competitors have performed? A comprehensive report shows you not only where your company stands, but also your competition. This allows you to react accordingly.
5. Estimated traffic value: How much is your content worth?
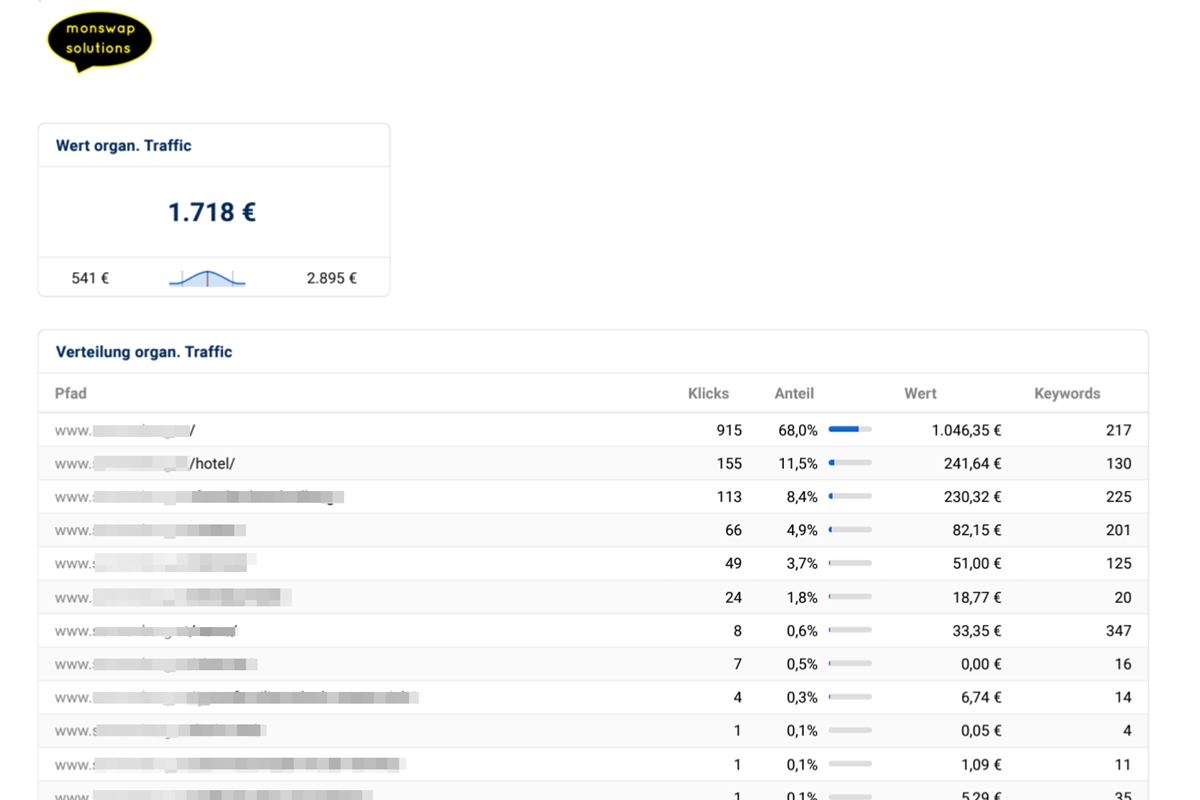
Especially useful: If you can find the return on investment (ROI) of your website content in the reporting. So:
➔ How much would ads cost that bring a comparable number of visitors to your site?
This metric is called "Value of Organic Traffic" (Sistrix) or "Estimated Value of Traffic" (Ubersuggest). It shows you at a glance whether your investment in website content is worthwhile.
Yes, of course, this metric is "only" based on informed estimates made by the tool. (Except for Ubersuggest: Here you can connect your account to Google Search Console and work with real data.)
Nevertheless, you can recognize clear trends from it – and it is incredibly valuable if you want to justify your marketing budget to yourself or to your boss .
6. Specific recommendations for action
A sound report should also derive concrete measures from this data and recommend next steps:
- Where are the opportunities for quick wins? This is where you start.
- Which pages should you update their content again ?
- Which pages are already performing exceptionally well – and how can you boost them even further?
- Where are backlinks, images, etc. missing?
Such concrete to-dos help you or your client to react to changes with action and to make the website ever better = more user-friendly.
My 3 favorite tools for SEO reporting
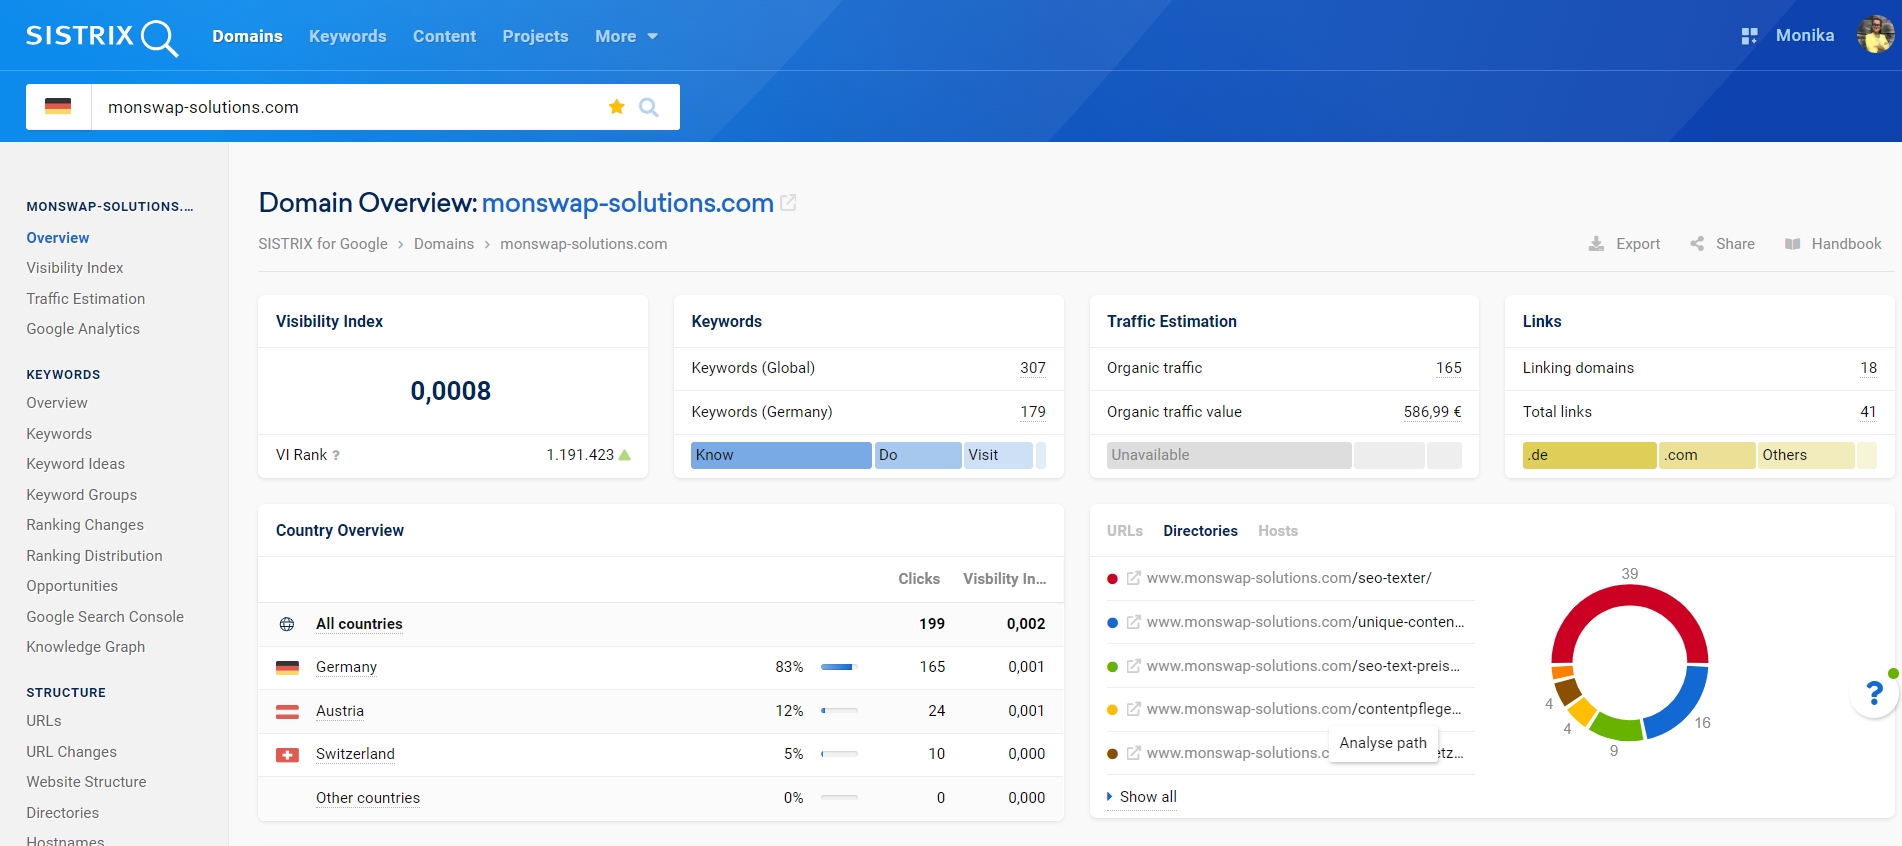
One of the most frequent questions clients ask me during consultations is: Which tools do you use for SEO reporting? Here are my 3 favorites:
- Sistrix: With Sistrix, you can monitor your website's visibility down to the last detail. The tool shows you which keywords your pages rank for and how the rankings change. You can even create branded SEO reports and calculate the value of organic traffic.
- Mangools: With Mangools' SERPWatcher, you can easily create reports to monitor your keywords. The tool automatically sends you weekly, monthly, and quarterly reports. It's easy to use and clearly shows you how your content is performing. Perfect for keeping an eye on things at a glance.
- Ubersuggest: With Ubersuggest's rank tracking feature, you can easily create keyword reports. The tool also offers detailed competitor analysis and integrates with Google Search Console to use real-world data. This allows you to calculate traffic value and therefore your ROI – ideal for concise, effective SEO keyword reporting.
I describe these tools in detail in my blog post "SEO Monitoring – Or: How hard is your website content working?". Take a look!
Stay tuned! Data leads to success
SEO is not a sprint, but a marathon. Stay consistent and regularly check your data. Only with the help of monitoring and reporting can you keep track of your data and ensure the long-term success of your website.
I'd be happy to help you with that.
What clients ask me about SEO reporting

Frequency: How often do reports make sense?
Typical consultant answer: It depends.
(And in this case, too, she is correct.)
- If you are very active on your website, publishing regular blog posts, adding new products, landing pages, or job postings, I recommend monthly reports. (For very large websites that focus heavily on SEO, even weekly reports are advisable.)
- If you have a small website and only publish one blog post per month, one report per quarter is sufficient.
I create reports about as often as I have time to update my content: usually once a week. Once a month or once a quarter can also be useful.
As often as you have time for content maintenance. This way you'll have enough data to identify trends and adjust your strategy.
Reports that are too frequent can be overwhelming and may even provide little meaningful data.
How do you create an SEO report?
A good SEO report should be clear and concise. Start with the most important metrics, such as traffic and rankings. Then add detailed analyses and concrete recommendations for action. Use reliable SEO reporting tools like Sistrix or Mangools to collect and meaningfully analyze the data. AI reporting will also play an increasingly important role in the future.
How do I interpret the data in the SEO report?
The data in a good SEO report shows you what works and what doesn't.
For example, if an important keyword loses ranking, you should be aware of it. This allows you to react and revise the relevant content.
If a blog post generates a lot of traffic, you can optimize it further – and create even more similar content.
The data from the reporting helps you to continuously improve your SEO strategy.